Visuals & Graphic Organizers

Visuals and graphic organizers can enhance as well as group and show relationships among ideas. Visuals and graphic organizers are important as strategies for reading, interpreting, recalling, and understanding information. The human brain is programmed visually; it “processes images 60 times faster than text, and 90 percent of the information transmitted to the brain is visual.” [1] According to How People Learn:
Different features of learning contribute to the durability or fragility of memory. For example, comparisons of people’s memories for words with their memories for pictures of the same objects show a superiority effect for pictures. The superiority effect of pictures is also true if words and pictures are combined during learning (Roediger, 1997). Obviously, this finding has direct relevance for improving the long-term learning of certain kinds of information. [2]
A study conducted by Georgetown University Medical Center and published 2015 also confirms that once the brain learns a new word, there is a small portion of the brain dealing with visual input that sees that word as a picture, grouping all of the letters together. In this way, we make sense of the image rather than processing letters separately to make meaning. [3]
Organizing information graphically plays on the propensity of the brain for images, and can help you process and recall information. You may remember the image of the graphic, which can cue your memory about the concepts in the graphic. And the acts of both interpreting and creating a visual helps you develop deeper comprehension, as you interact with information more fully.
How to Read Visual Texts

Brian Kennedy, director of the Toledo Museum of Art, states that “visual literacy is the ability to construct meaning from images. It’s not a skill. It uses skills as a toolbox. It’s a form of critical thinking that enhances your intellectual capacity.” [4]
Ask and answer these questions when you encounter visuals in your reading:
- What is the topic of the visual? – identify the text concept that is is being emphasized or illustrated
- What feeling does the visual project? – is it bright or dull? positive, negative, or neutral?
- Is the visual direct or symbolic? – if symbolic, what are the symbols and what do they imply?
- What does the visual’s type (e.g., photo, chart, video) have to do with the visual’s effect?
- What meaning do you think the author is trying to convey through the visual?
A Subset: How to Read Charts and Graphs
Ask and answer these questions when you encounter charts or graphs in your reading:
- What is the topic? – look for the title and reword it in your own words
- What is being measured? – look for labels to get an idea of what the graph is saying
- How is it being measured? – look for units & determine if the units make sense with what you know about the graph so far
- Is color-coding use and if so, how? – Check for a key that explains color-coding
- Can I summarize this information in my own words? – look for a trend and state it in your own words
try it
Ask and answer an appropriate combination of questions to help you read and interpret the image.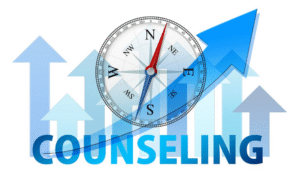
- What is the topic of the visual?
- What feeling does the visual project?
- Is the visual direct or symbolic?
- What does the visual’s type (e.g., photo, chart, video) have to do with the visual’s effect?
- What meaning do you think the author is trying to convey through the visual?
[reveal-answer q=”2″] Answers will vary [/reveal-answer]
[hidden-answer a=”2″]
- What is the topic? – counseling
- What feeling does the visual project? – brightness, positivity; it implies that this is something that can be done with positive effects
- Is the visual direct or symbolic? – It’s both direct and symbolic. The word “counseling” is direct. However, the compass and arrows are symbolic. The compass is pointing to north, and the concept of finding one’s “true north” refers to staying on track and successfully finding your way. The arrows are all pointing upward, which also implies positivity.
- What does the visual’s type (e.g., photo, chart, video) have to do with the visual’s effect? As a graphic the image can incorporate more meaning than a photograph of a successful or fulfilled person, as it implies that success and/or fulfillment can be attained through counseling. Even a photo of a person with the word counseling would not carry as immediate a meaning. If this were a chart of counseling successes, it would not carry as much emotional impact.
- What meaning do you think the author is trying to convey through the visual? that counseling can help one find direction and will result in a positive outcome
[/hidden-answer]
How to Use Graphic Organizers to Interact with a Text
Know that there are many types of graphic organizers, and know that you can create your own graphic organization as well. Some common graphic organizers include the following:
- lists
- Venn diagrams (two intersecting circles that show similarities between two things in the intersection)
- flow charts
- lines/shapes that indicate cause and effect or sequence
- mind maps
- matrices
- and more…
If you look in Word at the Insert > SmartArt options, you can get an even wider sense of the possibilities for graphic organization of information from the variety of shapes and purposes offered. All of these can be adapted as tools to apply during reading and note-taking processes.
Know that graphic organizers do not need to be complicated. Although there are many types, sometimes a simple list suffices as a means of organizing the text’s ideas and your own thoughts. The act of laying out information in a pattern that you can remember is key. The video below offers a quick discussion of many different graphic organizers; try those that resonate with you. Here are a few.
Concept/Mind Maps

Maps allow you to work with all of the information in the text in a more visual “shorthand” form to see patterns of organization, idea relationships, and/or idea development. An idea or mind map categorizes groups of ideas, differentiates between main and supporting ideas, shows at a glance how well-developed some idea groups are, and shows linkages among the idea groups by creating a visual pattern.
Mapping is an important reading and composing strategy. Mapping helps you identify and recall main ideas and supporting details. Mapping also can help you conceptualize a piece of writing, whether it’s writing that someone else has done or writing that you intend to do yourself.
“Conceptualize” is an important term. It means more than just noting the main ideas and their details; it means that you become aware of the way in which groups of ideas relate to one another (e.g., are they grouped into negatives and positives? Causes and effects? Does one main idea lead logically into the next main idea? By “drawing out” the idea groups in a map, you can discover their overall relationship to the main idea.
Here’s a sample paragraph and a map to note and remember main concepts.
Sample Paragraph
Children need small meals throughout the day to provide a consistent flow of glucose in their bodies. Glucose is stored in and released from the liver. A child’s liver, which is smaller than an adult’s, only stores about 4-6 hours’ worth of glucose. If a child wakes up at 6:00 a.m. and eats breakfast at 6:30 in order to start school at 7:30, it may be too late to wait until a 12:30 lunch period to restore the glucose supply needed for optimum brain function.
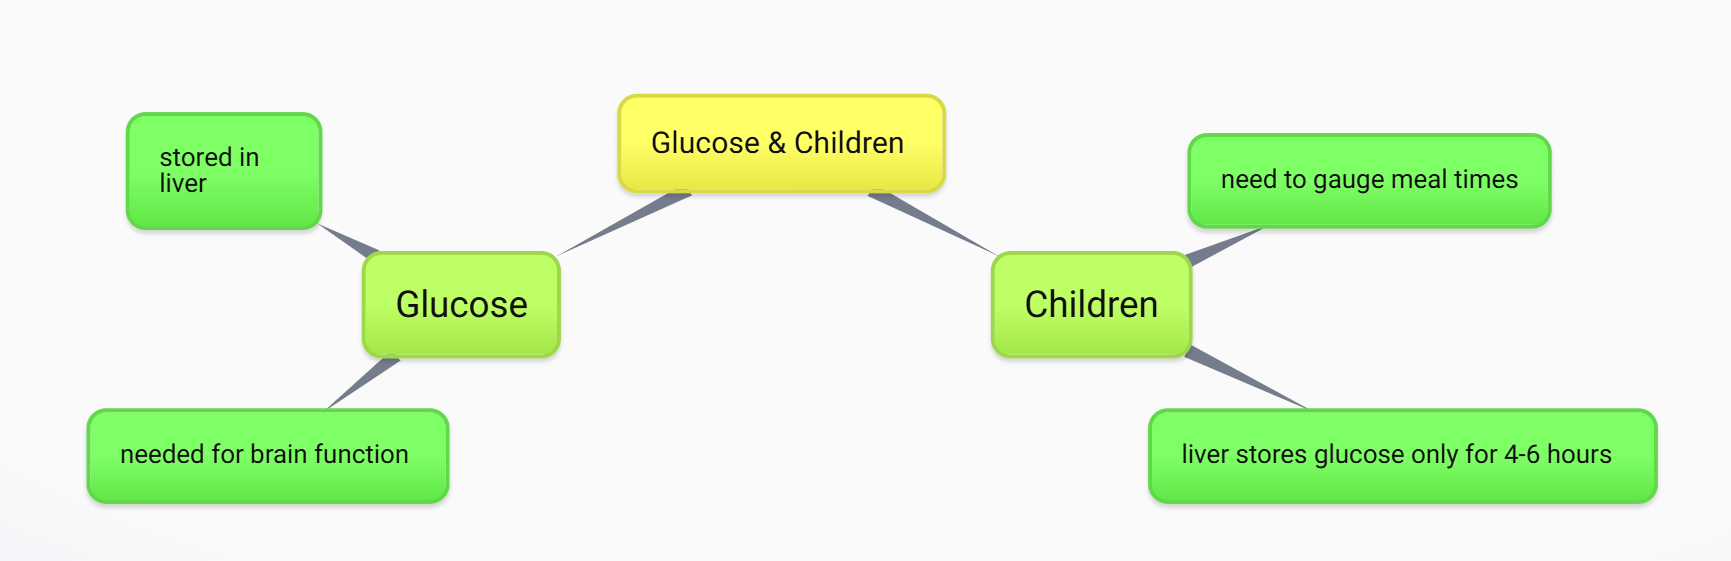
Sample mind map created using bubbl.us
The following video discusses graphic organizers and concept maps.
video Graphic Organizers and Concept Maps. Authored by: Jason Millard. Located at: https://www.youtube.com/watch?v=_LtLqvkV3yI. License: Other. License Terms: YouTube video
Try It
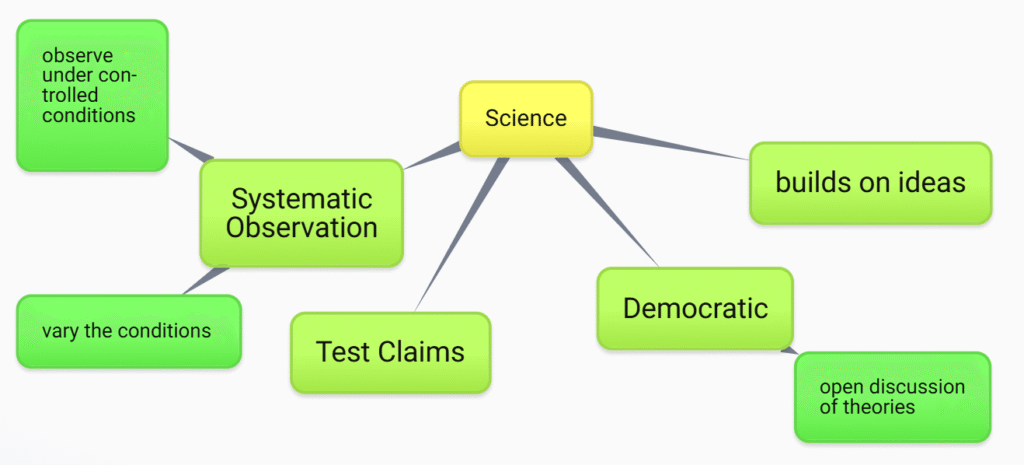
Read the “What is Science” section from Edward Diener’s article, “Why Science?” (The complete article is there because it’s interesting, but you only need to read the one section for this exercise.) After you read, create a mind map with the article’s main ideas and key supporting ideas. Then compare it with the sample below, with the understanding that mind maps will differ depending on the individual reader.
[reveal-answer q=”2″] Sample Mind Map (courtesy of bubbl.us) [/reveal-answer]
[hidden-answer a=”2″]
[/hidden-answer]
try it again
Read the article “Brainology,” by Carol Dweck (National Association of Independent Schools website, Winter, 2008). Create a simple matrix to organize main ideas.
Once you’ve done your own matrix, compare it with the sample, with the understanding that individual responses will differ.
[reveal-answer q=”3″] Sample Matrix [/reveal-answer]
[hidden-answer a=”3″]
| My Questions | topic: Fixed Mindset | topic: Growth Mindset |
| What does this mean? | feels that achievement is based on innate ability | feels that achievement can be gained through application and work |
| What are the benefits? | there don’t seem to be any benefits | students perform better |
| How are mindsets learned? | from praising the outcome of an action | from praising the effort that goes into learning |
| What do I think about this? | I think that this type of research is key for how we parent and teach our children. I will need to be more mindful in my wording when I praise my son. |
[/hidden-answer]
[1] http://www.t-sciences.com/news/humans-process-visual-data-better Eisenberg, Harris. “Humans Process Visual Data Better.” Thermopylae website. Published September 15, 2014.
[2] Bransford, John D., Brown, Ann L., Cocking, Rodney R., editors. Mind and Brain Chapter, How People Learn: Brain, Mind, Experience, and School. Consensus Study Report, The National Academies of Sciences, Engineering, Medicine, 2020. https://www.nap.edu/read/9853/chapter/8
[3] After Learning New Words, Brain Sees Them as Pictures. Georgetown University Medical Center website. March 24, 2015. https://gumc.georgetown.edu/news-release/after-learning-new-words-brain-sees-them-as-pictures/
[4]https://www.youtube.com/watch?v=E91fk6D0nwM Kennedy, Brian. Visual Literacy: Why We Need It. TedxDartmouth Talk. YouTube.
Content Attributions
- Visuals & Graphic Organizers, includes some information adapted from English Composition I; attribution below. Authored by: Susan Oaks. Project: Introduction to College Reading & Writing. License: CC BY-NC: Attribution-NonCommercial
- 5 Step Approach for Reading Charts and Graphs. Provided by: Lumen Learning. Located at: https://courses.lumenlearning.com/engcomp1-wmopen/chapter/text-5-step-approach-for-reading-charts-and-graphs/. Project: English Composition I. License: CC BY: Attribution
Media Attributions
- geralt-mind-mapping-4497350 © Gerd Altmann is licensed under a CC0 (Creative Commons Zero) license
- geralt-group-464644 © Gerd Altmann is licensed under a CC0 (Creative Commons Zero) license
- Screenshot 2026-05-12 163921 © Gerd Altmann is licensed under a CC0 (Creative Commons Zero) license
- dlxmedia-hu-ilTf1_qtLu0-unsplash © dlxmedia.hu is licensed under a CC0 (Creative Commons Zero) license
- Screenshot 2026-05-12 170556
- Screenshot 2026-05-12 172643